使用 Pandas 进行 JIRA 分析
 浏览:806
Problem
It's hard to argue Atlassian JIRA is one of the most popular issue trackers and project management solutions. You can love it, you can hate it, but if you were hired as a software engineer for some company, there is a high probability of meeting JIRA.
If the project you are working on is very active, there can be thousands of JIRA issues of various types. If you are leading a team of engineers, you can be interested in analytical tools that can help you understand what is going on in the project based on data stored in JIRA. JIRA has some reporting facilities integrated, as well as 3rd party plugins. But most of them are pretty basic. For example, it's hard to find rather flexible "forecasting" tools.
The bigger the project, the less satisfied you are with integrated reporting tools. At some point, you will end up using an API to extract, manipulate, and visualize the data. During the last 15 years of JIRA usage, I saw dozens of such scripts and services in various programming languages around this domain.
Many day-to-day tasks may require one-time data analysis, so writing services every time doesn't pay off. You can treat JIRA as a data source and use a typical data analytics tool belt. For example, you may take Jupyter, fetch the list of recent bugs in the project, prepare a list of "features" (attributes valuable for analysis), utilize pandas to calculate the statistics, and try to forecast trends using scikit-learn. In this article, I would like to explain how to do it.
Preparation
JIRA API Access
Here, we will talk about the cloud version of JIRA. But if you are using a self-hosted version, the main concepts are almost the same.
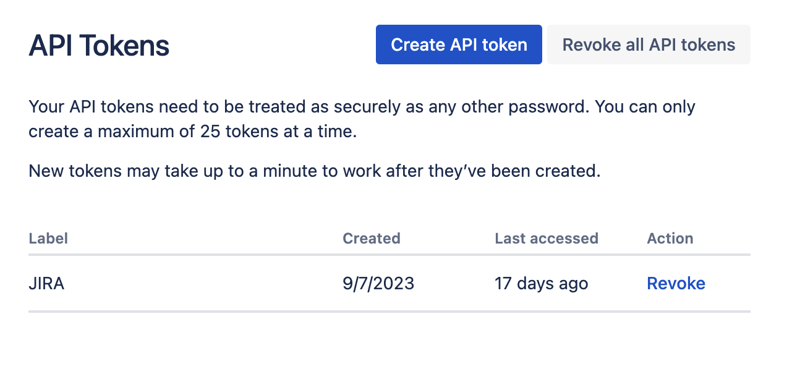
First of all, we need to create a secret key to access JIRA via REST API. To do so, go to profile management - https://id.atlassian.com/manage-profile/profile-and-visibility If you select the "Security" tab, you will find the "Create and manage API tokens" link:
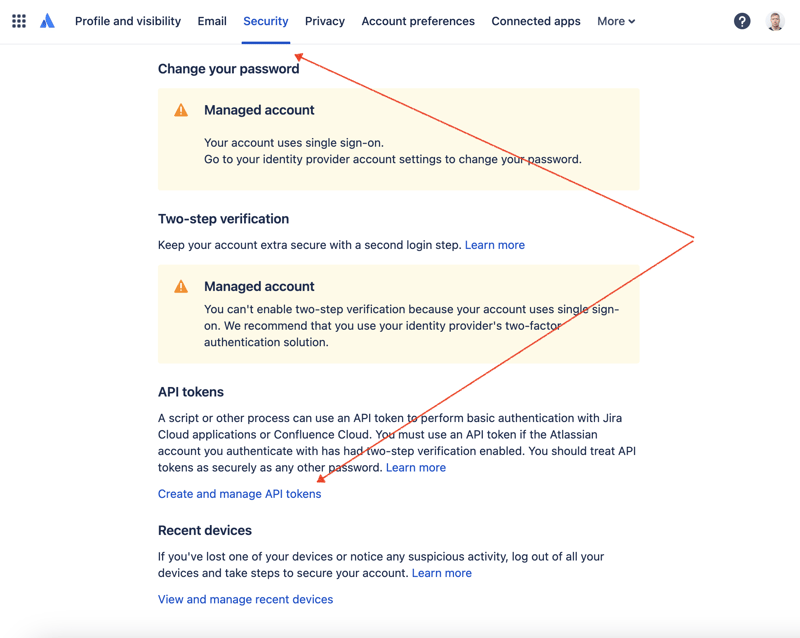
Create a new API token here and store it securely. We will use this token later.
Jupyter Notebooks
One of the most convenient ways to play with datasets is to utilize Jupyter. If you are not familiar with this tool, do not worry. I will show how to use it to solve our problem. For local experiments, I like to use DataSpell by JetBrains, but there are services available online and for free. One of the most well-known services among data scientists is Kaggle. However, their notebooks don't allow you to make external connections to access JIRA via API. Another very popular service is Colab by Google. It allows you to make remote connections and install additional Python modules.
JIRA has a pretty easy-to-use REST API. You can make API calls using your favorite way of doing HTTP requests and parse the response manually. However, we will utilize an excellent and very popular jira module for that purpose.
Tools in Action
Data Analysis
Let's combine all the parts to come up with the solution.
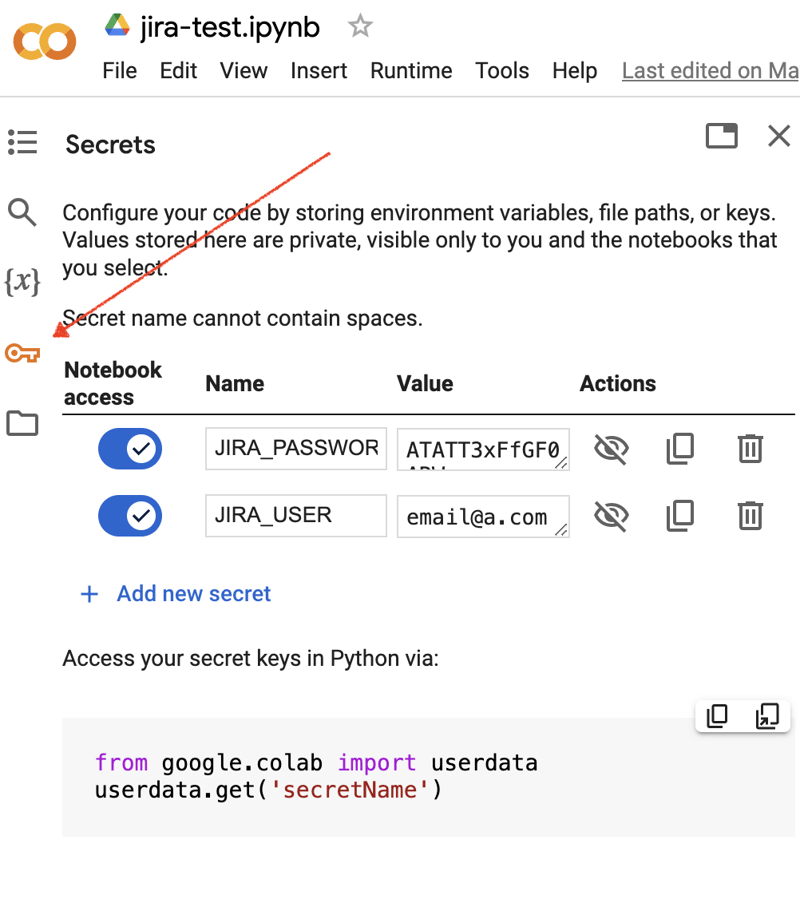
Go to the Google Colab interface and create a new notebook. After the notebook creation, we need to store previously obtained JIRA credentials as "secrets." Click the "Key" icon in the left toolbar to open the appropriate dialog and add two "secrets" with the following names: JIRA_USER and JIRA_PASSWORD. At the bottom of the screen, you can see the way how to access these "secrets":
The next thing is to install an additional Python module for JIRA integration. We can do it by executing the shell command in the scope of the notebook cell:
!pip install jira
The output should look something like the following:
Collecting jira
  Downloading jira-3.8.0-py3-none-any.whl (77 kB)
     ━━━━━━━━━━━━━━━━━━━━━━━━━━━━━━━━━━━━━━━━ 77.5/77.5 kB 1.3 MB/s eta 0:00:00
Requirement already satisfied: defusedxml in /usr/local/lib/python3.10/dist-packages (from jira) (0.7.1)
...
Installing collected packages: requests-toolbelt, jira
Successfully installed jira-3.8.0 requests-toolbelt-1.0.0
We need to fetch the "secrets"/credentials:
from google.colab import userdata

JIRA_URL = 'https://******.atlassian.net'
JIRA_USER = userdata.get('JIRA_USER')
JIRA_PASSWORD = userdata.get('JIRA_PASSWORD')
And validate the connection to the JIRA Cloud:
from jira import JIRA

jira = JIRA(JIRA_URL, basic_auth=(JIRA_USER, JIRA_PASSWORD))
projects = jira.projects()
projects
If the connection is ok and the credentials are valid, you should see a non-empty list of your projects:
[,
 ,
 ,
...
So we can connect and fetch data from JIRA. The next step is to fetch some data for analysis with pandas. Let’s try to fetch the list of solved problems during the last several weeks for some project:
JIRA_FILTER = 19762

issues = jira.search_issues(
    f'filter={JIRA_FILTER}',
    maxResults=False,
    fields='summary,issuetype,assignee,reporter,aggregatetimespent',
)
We need to transform the dataset into the pandas data frame:
import pandas as pd

df = pd.DataFrame([{
    'key': issue.key,
    'assignee': issue.fields.assignee and issue.fields.assignee.displayName or issue.fields.reporter.displayName,
    'time': issue.fields.aggregatetimespent,
    'summary': issue.fields.summary,
} for issue in issues])

df.set_index('key', inplace=True)

df
The output may look like the following:
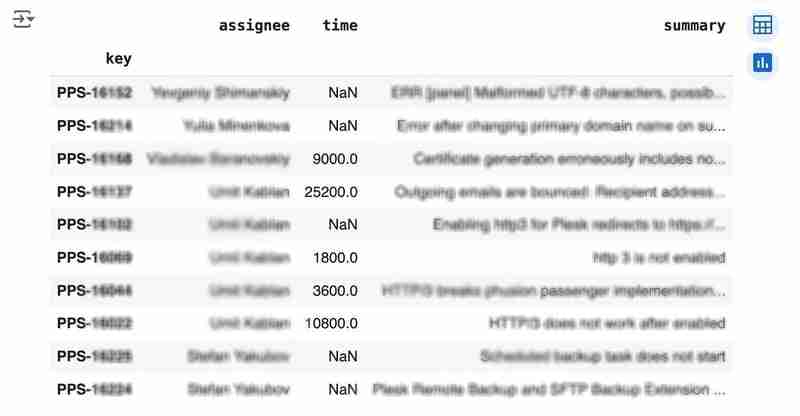
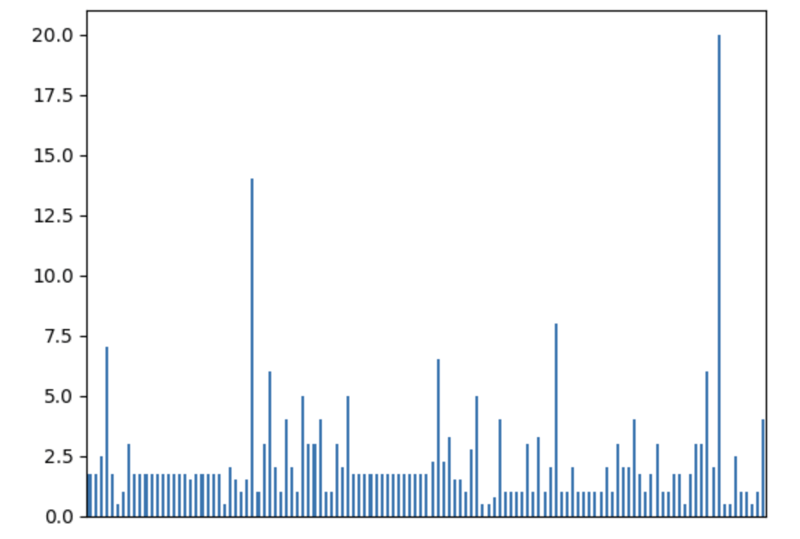
We would like to analyze how much time it usually takes to solve the issue. People are not ideal, so sometimes they forget to log the work. It brings a headache if you try to analyze such data using JIRA built-in tools. But it's not a problem for us to make some adjustments using pandas. For example, we can transform the "time" field from seconds into hours and replace the absent values with the median value (beware, dropna can be more suitable if there are a lot of gaps):
df['time'].fillna(df['time'].median(), inplace=True)
df['time'] = df['time'] / 3600
We can easily visualize the distribution to find out anomalies:
df['time'].plot.bar(xlabel='', xticks=[])
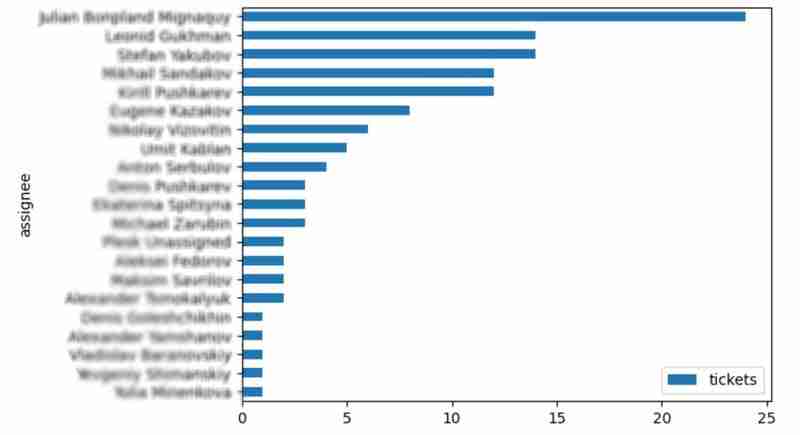
It is also interesting to see the distribution of solved problems by the assignee:
top_solvers = df.groupby('assignee').count()[['time']]
top_solvers.rename(columns={'time': 'tickets'}, inplace=True)
top_solvers.sort_values('tickets', ascending=False, inplace=True)

top_solvers.plot.barh().invert_yaxis()
It may look like the following:
Predictions
Let's try to predict the amount of time required to finish all open issues. Of course, we can do it without machine learning by using simple approximation and the average time to resolve the issue. So the predicted amount of required time is the number of open issues multiplied by the average time to resolve one. For example, the median time to solve one issue is 2 hours, and we have 9 open issues, so the time required to solve them all is 18 hours (approximation). It's a good enough forecast, but we might know the speed of solving depends on the product, team, and other attributes of the issue. If we want to improve the prediction, we can utilize machine learning to solve this task.
The high-level approach looks the following:
- Obtain the dataset for “learning”
- Clean up the data
- Prepare the "features" aka "feature engineering"
- Train the model
- Use the model to predict some value of the target dataset
For the first step, we will use a dataset of tickets for the last 30 weeks. Some parts here are simplified for illustrative purposes. In real life, the amount of data for learning should be big enough to make a useful model (e.g., in our case, we need thousands of issues to be analyzed).
issues = jira.search_issues(
    f'project = PPS AND status IN (Resolved) AND created >= -30w',
    maxResults=False,
    fields='summary,issuetype,customfield_10718,customfield_10674,aggregatetimespent',
)

closed_tickets = pd.DataFrame([{
    'key': issue.key,
    'team': issue.fields.customfield_10718,
    'product': issue.fields.customfield_10674,
    'time': issue.fields.aggregatetimespent,
} for issue in issues])

closed_tickets.set_index('key', inplace=True)
closed_tickets['time'].fillna(closed_tickets['time'].median(), inplace=True)

closed_tickets
In my case, it's something around 800 tickets and only two fields for "learning": "team" and "product."
The next step is to obtain our target dataset. Why do I do it so early? I want to clean up and do "feature engineering" in one shot for both datasets. Otherwise, the mismatch between the structures can cause problems.
issues = jira.search_issues(
    f'project = PPS AND status IN (Open, Reopened)',
    maxResults=False,
    fields='summary,issuetype,customfield_10718,customfield_10674',
)

open_tickets = pd.DataFrame([{
    'key': issue.key,
    'team': issue.fields.customfield_10718,
    'product': issue.fields.customfield_10674,
} for issue in issues])

open_tickets.set_index('key', inplace=True)

open_tickets
Please notice we have no "time" column here because we want to predict it. Let's nullify it and combine both datasets to prepare the "features."
open_tickets['time'] = 0
tickets = pd.concat([closed_tickets, open_tickets])

tickets
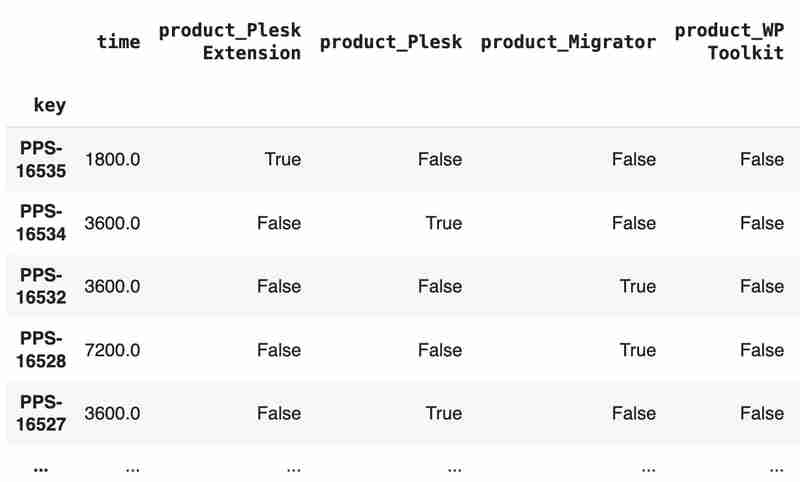
Columns "team" and "product" contain string values. One of the ways of dealing with that is to transform each value into separate fields with boolean flags.
products = pd.get_dummies(tickets['product'], prefix='product')
tickets = pd.concat([tickets, products], axis=1)
tickets.drop('product', axis=1, inplace=True)

teams = pd.get_dummies(tickets['team'], prefix='team')
tickets = pd.concat([tickets, teams], axis=1)
tickets.drop('team', axis=1, inplace=True)

tickets
The result may look like the following:
After the combined dataset preparation, we can split it back into two parts:
closed_tickets = tickets[:len(closed_tickets)]
open_tickets = tickets[len(closed_tickets):][:]
Now it's time to train our model:
from sklearn.model_selection import train_test_split
from sklearn.tree import DecisionTreeRegressor

features = closed_tickets.drop(['time'], axis=1)
labels = closed_tickets['time']

features_train, features_val, labels_train, labels_val = train_test_split(features, labels, test_size=0.2)

model = DecisionTreeRegressor()
model.fit(features_train, labels_train)
model.score(features_val, labels_val)
And the final step is to use our model to make a prediction:
open_tickets['time'] = model.predict(open_tickets.drop('time', axis=1, errors='ignore'))
open_tickets['time'].sum() / 3600
The final output, in my case, is 25 hours, which is higher than our initial rough estimation. This was a basic example. However, by using ML tools, you can significantly expand your abilities to analyze JIRA data.
Conclusion
Sometimes, JIRA built-in tools and plugins are not sufficient for effective analysis. Moreover, many 3rd party plugins are rather expensive, costing thousands of dollars per year, and you will still struggle to make them work the way you want. However, you can easily utilize well-known data analysis tools by fetching necessary information via JIRA API and go beyond these limitations. I spent so many hours playing with various JIRA plugins in attempts to create good reports for projects, but they often missed some important parts. Building a tool or a full-featured service on top of JIRA API also often looks like overkill. That's why typical data analysis and ML tools like Jupiter, pandas, matplotlib, scikit-learn, and others may work better here.

-
 我可以将加密从McRypt迁移到OpenSSL,并使用OpenSSL迁移MCRYPT加密数据?将我的加密库从mcrypt升级到openssl 问题:是否可以将我的加密库从McRypt升级到OpenSSL?如果是这样,如何?答案:是的,可以将您的Encryption库从McRypt升级到OpenSSL。可以使用openssl。附加说明: [openssl_decrypt()函数要求iv参...编程 发布于2025-06-25
 -
JavaScript计算两个日期之间天数的方法How to Calculate the Difference Between Dates in JavascriptAs you attempt to determine the difference between two dates in Javascript, consider this s...编程 发布于2025-06-25
-
-
在Java中使用for-to-loop和迭代器进行收集遍历之间是否存在性能差异?For Each Loop vs. Iterator: Efficiency in Collection TraversalIntroductionWhen traversing a collection in Java, the choice arises between using a for-...编程 发布于2025-06-25
-
为什么HTML无法打印页码及解决方案无法在html页面上打印页码? @page规则在@Media内部和外部都无济于事。 HTML:Customization:@page { margin: 10%; @top-center { font-family: sans-serif; font-weight: bo...编程 发布于2025-06-25
-
CSS可以根据任何属性值来定位HTML元素吗?靶向html元素,在CSS 中使用任何属性值,在CSS中,可以基于特定属性(如下所示)基于特定属性的基于特定属性的emants目标元素: 字体家庭:康斯拉斯(Consolas); } 但是,出现一个常见的问题:元素可以根据任何属性值而定位吗?本文探讨了此主题。的目标元素有任何任何属性值,属...编程 发布于2025-06-25
-
表单刷新后如何防止重复提交?在Web开发中预防重复提交 在表格提交后刷新页面时,遇到重复提交的问题是常见的。要解决这个问题,请考虑以下方法: 想象一下具有这样的代码段,看起来像这样的代码段:)){ //数据库操作... 回声“操作完成”; 死(); } ?> ...编程 发布于2025-06-25
-
在JavaScript中如何并发运行异步操作并正确处理错误?同意操作execution 在执行asynchronous操作时,相关的代码段落会遇到一个问题,当执行asynchronous操作:此实现在启动下一个操作之前依次等待每个操作的完成。要启用并发执行,需要进行修改的方法。 第一个解决方案试图通过获得每个操作的承诺来解决此问题,然后单独等待它们: co...编程 发布于2025-06-25
-
如何使用替换指令在GO MOD中解析模块路径差异?在使用GO MOD时,在GO MOD 中克服模块路径差异时,可能会遇到冲突,其中可能会遇到一个冲突,其中3派对软件包将另一个带有导入套件的path package the Imptioned package the Imptioned package the Imported tocted pac...编程 发布于2025-06-25
-
Python元类工作原理及类创建与定制python中的metaclasses是什么? Metaclasses负责在Python中创建类对象。就像类创建实例一样,元类也创建类。他们提供了对类创建过程的控制层,允许自定义类行为和属性。在Python中理解类作为对象的概念,类是描述用于创建新实例或对象的蓝图的对象。这意味着类本身是使用类关...编程 发布于2025-06-25
-
如何正确使用与PDO参数的查询一样?在pdo 中使用类似QUERIES在PDO中的Queries时,您可能会遇到类似疑问中描述的问题:此查询也可能不会返回结果,即使$ var1和$ var2包含有效的搜索词。错误在于不正确包含%符号。通过将变量包含在$ params数组中的%符号中,您确保将%字符正确替换到查询中。没有此修改,PDO...编程 发布于2025-06-25
-
eval()vs. ast.literal_eval():对于用户输入,哪个Python函数更安全?称量()和ast.literal_eval()中的Python Security 在使用用户输入时,必须优先确保安全性。强大的Python功能Eval()通常是作为潜在解决方案而出现的,但担心其潜在风险。 This article delves into the differences betwee...编程 发布于2025-06-25
-
FastAPI自定义404页面创建指南response = await call_next(request) if response.status_code == 404: return RedirectResponse("https://fastapi.tiangolo.com") else: ...编程 发布于2025-06-25
-
同实例无需转储复制MySQL数据库方法在同一实例上复制一个MySQL数据库而无需转储在同一mySQL实例上复制数据库,而无需创建InterMediate sqql script。以下方法为传统的转储和IMPORT过程提供了更简单的替代方法。 直接管道数据 MySQL手动概述了一种允许将mysqldump直接输出到MySQL clie...编程 发布于2025-06-25


学习中文
- 1 走路用中文怎么说?走路中文发音,走路中文学习
- 2 坐飞机用中文怎么说?坐飞机中文发音,坐飞机中文学习
- 3 坐火车用中文怎么说?坐火车中文发音,坐火车中文学习
- 4 坐车用中文怎么说?坐车中文发音,坐车中文学习
- 5 开车用中文怎么说?开车中文发音,开车中文学习
- 6 游泳用中文怎么说?游泳中文发音,游泳中文学习
- 7 骑自行车用中文怎么说?骑自行车中文发音,骑自行车中文学习
- 8 你好用中文怎么说?你好中文发音,你好中文学习
- 9 谢谢用中文怎么说?谢谢中文发音,谢谢中文学习
- 10 How to say goodbye in Chinese? 再见Chinese pronunciation, 再见Chinese learning