什么是金融市场?
 浏览:363
Introduction
Financial markets are platforms where buyers and sellers come together to trade financial assets like stocks, bonds, currencies, and commodities. These markets play a crucial role in the economy by facilitating the flow of capital and enabling price discovery, risk management, and the allocation of resources.
Types of Financial Markets
Stock Market: A market where shares of publicly listed companies are bought and sold. Examples include the New York Stock Exchange (NYSE) and Nasdaq.
Bond Market: This market deals with the buying and selling of debt securities, primarily bonds issued by corporations, municipalities, and governments.
Commodities Market: A market where raw materials like gold, oil, and agricultural products are traded. Major examples include the Chicago Mercantile Exchange (CME) and the London Metal Exchange (LME).
Forex Market: Also known as the foreign exchange market, it's where currencies are traded. The Forex market is the largest and most liquid financial market in the world.
Derivatives Market: A market for financial contracts (such as options and futures) that derive their value from an underlying asset, like stocks, bonds, or commodities.
Portfolio of Stocks
A portfolio is a collection of financial assets such as stocks, bonds, and other securities owned by an individual or institution. Diversifying a portfolio—investing in a variety of assets—can help reduce risk. For instance, if one stock underperforms, gains in another might offset the loss, leading to a more stable return.
Python Examples
I'll assume you already know the basic of python programming. Thus, I recommend creating a python environment python -m venv venv and then installing the libraries shown below
pip install yfinance pandas matplotlib
Let's analyze a basic basic example of fetching historical stock data using the yfinance library.
import yfinance as yf
import matplotlib.pyplot as plt

# Fetching data for Apple, Microsoft, and Google
stocks = ['AAPL', 'MSFT', 'GOOGL']
data = yf.download(stocks, start="2023-01-01", end="2024-01-01")

# Plotting the closing prices
data['Close'].plot(figsize=(10, 7))
plt.title("Stock Prices")
plt.xlabel("Date")
plt.ylabel("Price (USD)")
plt.show()
At the moment I executed the code above I got the following image
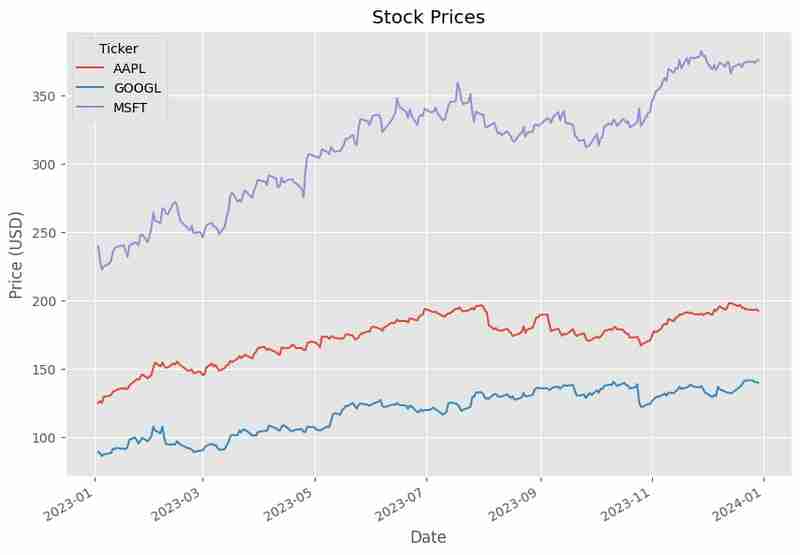
We can see from the image above that, as stated in our code, we are retrieving the stock values for the companies Apple, Google, and Microsoft for the period starting on '2023-01-01' and ending on '2024-01-01'
Why AAPL, MSFT, GOOGL though?
A ticker symbol is a unique series of letters assigned to a security or stock for trading purposes. This symbol serves as an abbreviation that identifies a particular stock on a stock exchange. Here’s a breakdown of ticker symbols for some well-known companies:
AAPL: This is the ticker symbol for Apple Inc., one of the world's largest technology companies known for products like the iPhone, iPad, and Mac computers.
MSFT: This symbol represents Microsoft Corporation, a leading technology company specializing in software, personal computers, and services like Azure cloud computing.
GOOGL: Alphabet Inc. uses this ticker for its Class A shares. Alphabet is the parent company of Google, the world's leading search engine and digital advertising platform.
AMZN: This is the ticker for Amazon.com, Inc., a major player in e-commerce, cloud computing, and streaming services.
NFLX: The ticker symbol for Netflix, Inc., a leading streaming entertainment service provider, is NFLX.
FB: Meta Platforms, Inc. (formerly Facebook, Inc.) trades under this symbol, representing one of the largest social media and technology companies.
NVDA: NVIDIA Corporation uses this ticker. NVIDIA is a leading manufacturer of graphics processing units (GPUs) for gaming and professional markets, as well as system on a chip units for mobile devices and automotive markets.
These ticker symbols are essential for investors, analysts, and traders as they provide a quick and easy way to identify and trade stocks on the various stock exchanges around the world.
Portfolio of Stocks
Let’s say now you have a portfolio with equal investments in Apple, Microsoft, and Google. How can you calculate the portfolio’s returns?
Let's write a python script for this.
import pandas as pd

# Assuming equal weights for each stock
weights = [1/3, 1/3, 1/3]

# Calculate daily returns
returns = data['Close'].pct_change()

# Calculate portfolio returns
portfolio_returns = returns.dot(weights)

# Plotting the portfolio returns
portfolio_returns.plot(figsize=(10, 7))
plt.title("Portfolio Returns")
plt.xlabel("Date")
plt.ylabel("Return")
plt.show()
Then, we obtain the following output image which represents our daily portfolio returns.
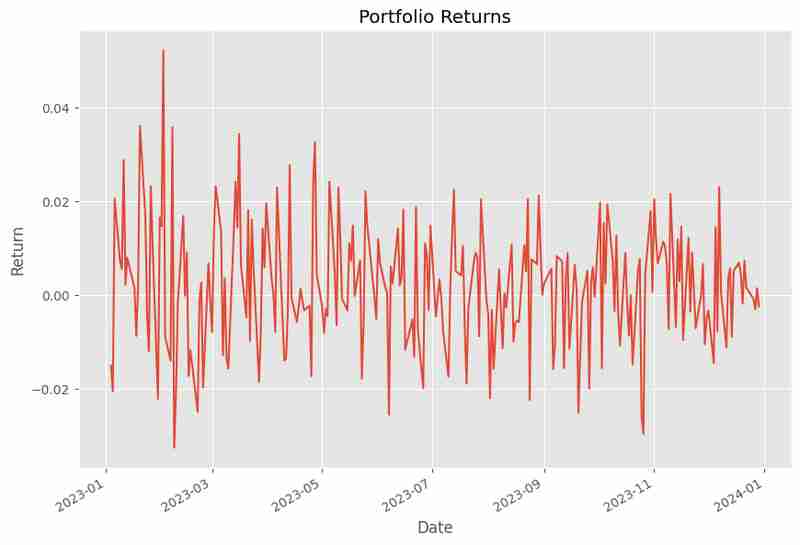
However, this graph above is a bit hard to understand. How could we get a better intuition of what's happening with our money? Let's see another script
# Calculating cumulative returns
cumulative_returns = (1   portfolio_returns).cumprod() - 1

# Calculating mean and standard deviation of returns
mean_return = portfolio_returns.mean()
std_dev = portfolio_returns.std()

print(f"Cumulative Return: {cumulative_returns[-1]:.2%}")
print(f"Average Daily Return: {mean_return:.2%}")
print(f"Volatility (Std Dev): {std_dev:.2%}")
Basically here is what we're doing.
In financial analysis, it’s essential to evaluate how a portfolio has performed over time. The following metrics are key to understanding the returns and risk associated with a portfolio.
In financial analysis, it’s essential to evaluate how a portfolio has performed over time. The following metrics are key to understanding the returns and risk associated with a portfolio.
1. Cumulative Returns
Cumulative return is a measure of the total return on an investment over a period, assuming all profits are reinvested. It is calculated by multiplying the returns for each period (1 return), then subtracting 1 at the end.
The formula for cumulative return
Rc
over a series of periods is:
Where:
rt is the return in period t.
n is the total number of periods.
In the Python code:
cumulative_returns = (1 portfolio_returns).cumprod() - 1
portfolio_returns is a series of daily returns.
(1 portfolio_returns).cumprod() calculates the cumulative product of 1 rt over the series, and subtracting 1 gives the cumulative return.
2. Mean Return (Average Daily Return)
The mean return is the average return of the portfolio over a specified period. It provides insight into what an investor might expect to earn per period, on average.
The formula for mean return μ is:
Where:
rt is the return in period t.
n is the total number of periods.
In Python:
mean_return = portfolio_returns.mean()
portfolio_returns.mean() computes the average of all daily returns.
3. Volatility (Standard Deviation of Returns)
Volatility is a measure of the risk or uncertainty associated with the returns of a portfolio. It is typically measured using the standard deviation, which quantifies how much the returns deviate from the mean return.
The formula for standard deviation σ is:
Where:
rt is the return in period t.
μ is the mean return.
n is the total number of periods.
In Python:
std_dev = portfolio_returns.std()
portfolio_returns.std() computes the standard deviation of daily returns.
4. Putting It All Together
Finally, you can print the calculated cumulative return, average daily return, and volatility:
print(f"Cumulative Return: {cumulative_returns[-1]:.2%}")
print(f"Average Daily Return: {mean_return:.2%}")
print(f"Volatility (Std Dev): {std_dev:.2%}")
cumulative_returns[-1] fetches the last value in the cumulative returns series, representing the total cumulative return up to the most recent date.
mean_return and std_dev represent the average daily return and the portfolio's volatility, respectively.
Summary
Cumulative Return provides the overall growth of the portfolio, assuming reinvestment of returns.
Mean Return gives the average return per period, indicating the portfolio's typical performance.
Volatility (Standard Deviation) quantifies the risk or variability in returns, with higher volatility indicating greater risk.
Understanding these metrics helps investors assess both the potential reward and the risk associated with a portfolio. For our example then we have the following results:
Cumulative Return: 57.54%
Average Daily Return: 0.19%
Volatility (Std Dev): 1.31%
That's it for now!
If you've made it this far, I want to express my gratitude. I hope this has been helpful to someone other than just me!
✧⁺⸜(^-^)⸝⁺✧
-
 如何限制动态大小的父元素中元素的滚动范围?在交互式接口中实现垂直滚动元素的CSS高度限制问题:考虑一个布局,其中我们具有与用户垂直滚动一起移动的可滚动地图div,同时与固定的固定sidebar保持一致。但是,地图的滚动无限期扩展,超过了视口的高度,阻止用户访问页面页脚。$("#map").css({ marginT...编程 发布于2025-05-01
 -
如何从PHP中的数组中提取随机元素?从阵列中的随机选择,可以轻松从数组中获取随机项目。考虑以下数组:; 从此数组中检索一个随机项目,利用array_rand( array_rand()函数从数组返回一个随机键。通过将$项目数组索引使用此键,我们可以从数组中访问一个随机元素。这种方法为选择随机项目提供了一种直接且可靠的方法。编程 发布于2025-05-01
-
`console.log`显示修改后对象值异常的原因foo = [{id:1},{id:2},{id:3},{id:4},{id:id:5},],]; console.log('foo1',foo,foo.length); foo.splice(2,1); console.log('foo2', foo, foo....编程 发布于2025-05-01
-
在程序退出之前,我需要在C ++中明确删除堆的堆分配吗?在C中的显式删除 在C中的动态内存分配时,开发人员通常会想知道是否有必要在heap-procal extrable exit exit上进行手动调用“ delete”操作员,但开发人员通常会想知道是否需要手动调用“ delete”操作员。本文深入研究了这个主题。 在C主函数中,使用了动态分配变量(H...编程 发布于2025-05-01
-
如何使用“ JSON”软件包解析JSON阵列?parsing JSON与JSON软件包 QUALDALS:考虑以下go代码:字符串 } func main(){ datajson:=`[“ 1”,“ 2”,“ 3”]`` arr:= jsontype {} 摘要:= = json.unmarshal([] byte(...编程 发布于2025-05-01
-
PHP阵列键值异常:了解07和08的好奇情况PHP数组键值问题,使用07&08 在给定数月的数组中,键值07和08呈现令人困惑的行为时,就会出现一个不寻常的问题。运行print_r($月份)返回意外结果:键“ 07”丢失,而键“ 08”分配给了9月的值。此问题源于PHP对领先零的解释。当一个数字带有0(例如07或08)的前缀时,PHP将...编程 发布于2025-05-01
-
在PHP中如何高效检测空数组?在PHP 中检查一个空数组可以通过各种方法在PHP中确定一个空数组。如果需要验证任何数组元素的存在,则PHP的松散键入允许对数组本身进行直接评估:一种更严格的方法涉及使用count()函数: if(count(count($ playerList)=== 0){ //列表为空。 } 对...编程 发布于2025-05-01
-
PHP的`spl_autoload`、`spl_autoload_register`和`spl_autoload_extensions`如何简化类加载?自动加载:harnessing spl_autoload and spl_autoload_register 在这种情况下,实例化“ myclass”类时,PHP调用已注册的“米亚托洛洛载体”函数,该功能动态包含必要的类文件。 This eliminates the need for manua...编程 发布于2025-05-01
-
表单刷新后如何防止重复提交?在Web开发中预防重复提交 在表格提交后刷新页面时,遇到重复提交的问题是常见的。要解决这个问题,请考虑以下方法: 想象一下具有这样的代码段,看起来像这样的代码段:)){ //数据库操作... 回声“操作完成”; 死(); } ?> ...编程 发布于2025-05-01
-
Python不会对超范围子串切片报错的原因在python中用索引切片范围:二重性和空序列索引单个元素不同,该元素会引起错误,切片在序列的边界之外没有。这种行为源于索引和切片之间的基本差异。索引一个序列,例如“示例” [3],返回一个项目。但是,切片序列(例如“示例” [3:4])返回项目的子序列。索引不存在的元素时,例如“示例” [9] ...编程 发布于2025-05-01
-
如何有效地转换PHP中的时区?在PHP 利用dateTime对象和functions DateTime对象及其相应的功能别名为时区转换提供方便的方法。例如: //定义用户的时区 date_default_timezone_set('欧洲/伦敦'); //创建DateTime对象 $ dateTime = ne...编程 发布于2025-05-01
-
如何在其容器中为DIV创建平滑的左右CSS动画?通用CSS动画,用于左右运动 ,我们将探索创建一个通用的CSS动画,以向左和右移动DIV,从而到达其容器的边缘。该动画可以应用于具有绝对定位的任何div,无论其未知长度如何。问题:使用左直接导致瞬时消失 更加流畅的解决方案:混合转换和左 [并实现平稳的,线性的运动,我们介绍了线性的转换。这...编程 发布于2025-05-01
-
为什么在我的Linux服务器上安装Archive_Zip后,我找不到“ class \” class \'ziparchive \'错误?class'ziparchive'在Linux Server上安装Archive_zip时找不到错误 commant in lin ins in cland ins in lin.11 on a lin.1 in a lin.11错误:致命错误:在... cass中找不到类z...编程 发布于2025-05-01
-
在细胞编辑后,如何维护自定义的JTable细胞渲染?在JTable中维护jtable单元格渲染后,在JTable中,在JTable中实现自定义单元格渲染和编辑功能可以增强用户体验。但是,至关重要的是要确保即使在编辑操作后也保留所需的格式。在设置用于格式化“价格”列的“价格”列,用户遇到的数字格式丢失的“价格”列的“价格”之后,问题在设置自定义单元格...编程 发布于2025-05-01
-
查找当前执行JavaScript的脚本元素方法如何引用当前执行脚本的脚本元素在某些方案中理解问题在某些方案中,开发人员可能需要将其他脚本动态加载其他脚本。但是,如果Head Element尚未完全渲染,则使用document.getElementsbytagname('head')[0] .appendChild(v)的常规方...编程 发布于2025-05-01


学习中文
- 1 走路用中文怎么说?走路中文发音,走路中文学习
- 2 坐飞机用中文怎么说?坐飞机中文发音,坐飞机中文学习
- 3 坐火车用中文怎么说?坐火车中文发音,坐火车中文学习
- 4 坐车用中文怎么说?坐车中文发音,坐车中文学习
- 5 开车用中文怎么说?开车中文发音,开车中文学习
- 6 游泳用中文怎么说?游泳中文发音,游泳中文学习
- 7 骑自行车用中文怎么说?骑自行车中文发音,骑自行车中文学习
- 8 你好用中文怎么说?你好中文发音,你好中文学习
- 9 谢谢用中文怎么说?谢谢中文发音,谢谢中文学习
- 10 How to say goodbye in Chinese? 再见Chinese pronunciation, 再见Chinese learning