从数据到决策:数据分析和机器学习如何推动业务增长
 浏览:741
In this article, we explore and analyze a sales dataset to gain valuable insights and drive business growth. We have undertaken various steps, from data preprocessing to machine learning model training, to extract meaningful information and make informed decisions. Through this documentation, we aim to present our findings, methodologies, and recommendations to enhance sales performance, identify key customer segments, and optimize marketing strategies.
Dataset Overview
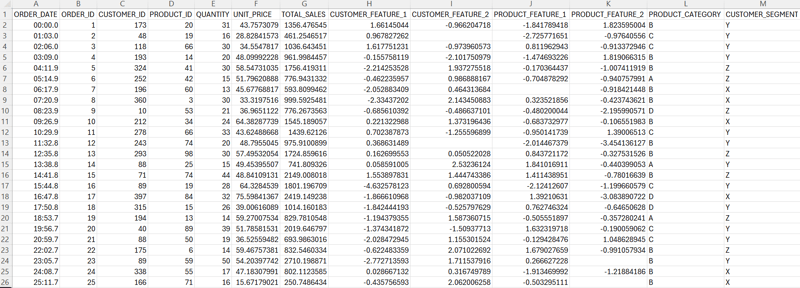
In this dataset, we have the following features:
- ORDER_ID: Unique identifier for each order.
- CUSTOMER_ID: Identifier for the customer who made the order.
- PRODUCT_ID: Identifier for the product in the order.
- ORDER_DATE: Date the order was made.
- QUANTITY: Quantity of the product in the order.
- UNIT_PRICE: Unit price of the product in the order.
- TOTAL_SALES: Total sales for this order (calculated as QUANTITY * UNIT_PRICE).
- CUSTOMER_FEATURE_1, CUSTOMER_FEATURE_2: Synthetic features representing customer properties.
- PRODUCT_FEATURE_1, PRODUCT_FEATURE_2: Synthetic features representing product properties.
What You'll Learn
In this article, we guide you through:
. Data Cleaning and Preprocessing: How we cleaned the dataset and handled missing values, with an explanation of the chosen methods.
. Exploratory Data Analysis: Insights on sales distribution, relationships between features, and the identification of patterns or anomalies.
. Model Development and Evaluation: Training a machine learning model to forecast TOTAL_SALES, evaluating its performance with relevant metrics.
. Business Insights: Key findings to enhance sales performance, optimize marketing strategies, and identify top-performing product categories and customer segments.
Let's dive into the analysis and discover how these insights can drive business growth.
. Data Cleaning and Preprocessing
1. A Deep Dive into Dataset: Detecting Null Values
To ensure the accuracy of our analysis, we began by thoroughly examining the dataset to identify columns with missing or null values. We counted the number of null values in each column to assess the extent of missing data. This step is crucial as missing values can significantly impact the quality of our analysis.
2. Categorizing Data: Identifying Categorical Columns
Next, we identified the categorical columns within our dataset. These columns typically contain discrete values representing different categories or labels. By evaluating the number of unique values in each categorical column, we gained insights into the diversity of categories present, which helps us understand potential grouping patterns and relationships within the data.
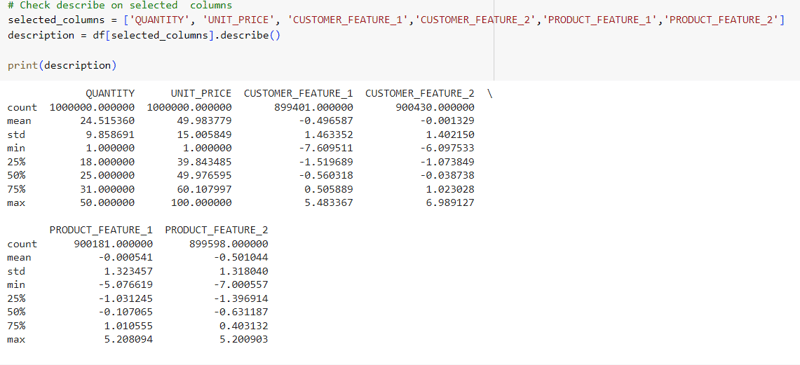
3. Dataset Overview and Handling Missing Data
We utilized the describe() function to obtain a concise summary of the dataset's numerical columns. This function provides essential statistical properties, including count, mean, standard deviation, quartiles, minimum, and maximum values. Our histogram and box plot analyses revealed that the numerical columns did not exhibit significant skewness. Therefore, to handle missing values, we opted to replace them with the mean value of each respective column. This approach helps maintain data integrity for subsequent analysis.
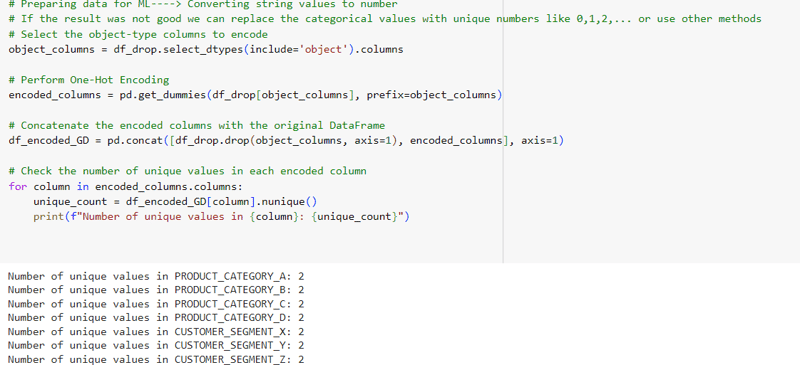
4. Converting Categorical Columns: Creating Numerical Representations
To prepare the categorical data for machine learning algorithms, we employed techniques such as one-hot encoding and the get_dummies() function. These methods convert categorical columns into numerical formats by creating binary variables, allowing algorithms to effectively process and analyze the data.
5. Feature Selection: Removing Unnecessary Columns
Finally, we examined the 'ORDER_DATE' and 'ORDER_ID' columns. Since these columns contain unique values for each row, they do not provide meaningful patterns or relationships for machine learning models. Including them in the model would not contribute valuable information for predicting the target variable. Consequently, we decided to exclude these columns from the feature set used for ML modeling. We made a copy of the original dataframe before removing these columns. This copy will be utilized for visualization and analyzing feature relationships, while the modified dataframe, with the unnecessary columns dropped, will be used for model training to enhance prediction performance.
. Exploratory Data Analysis
In this section, we delve into an in-depth exploration of the dataset to understand the relationships between various features and sales. Our analysis focuses on customer segments, product categories, and seasonal trends to uncover insights that can enhance sales performance.
To reveal meaningful patterns, we employed various visualization techniques, including bar plots, line plots, and descriptive statistics. This exploration aimed to identify dominant customer segments, popular product categories, and variations in sales behavior over time.
Here are the key findings from our exploratory analysis:
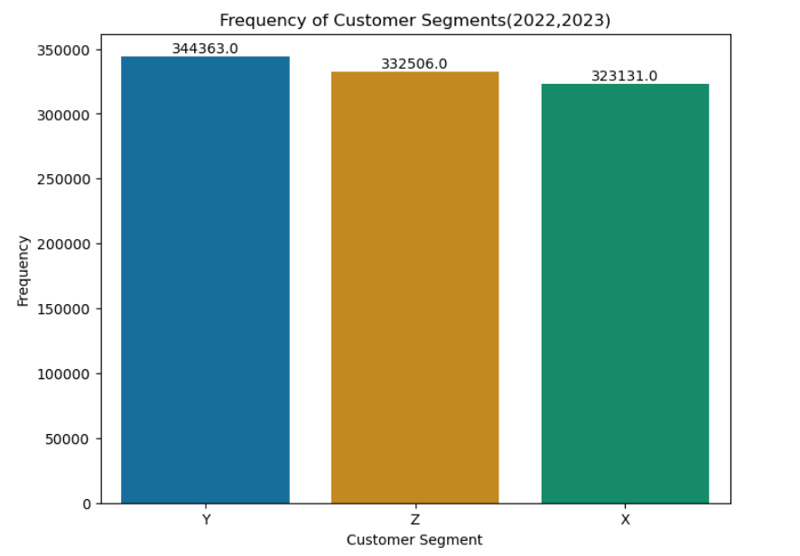
1. Customer Segments Frequency
- The 'Y' customer segment emerged as the most frequent, followed by 'Z' and 'X.' Each segment differed by approximately 10,000 occurrences in orders.
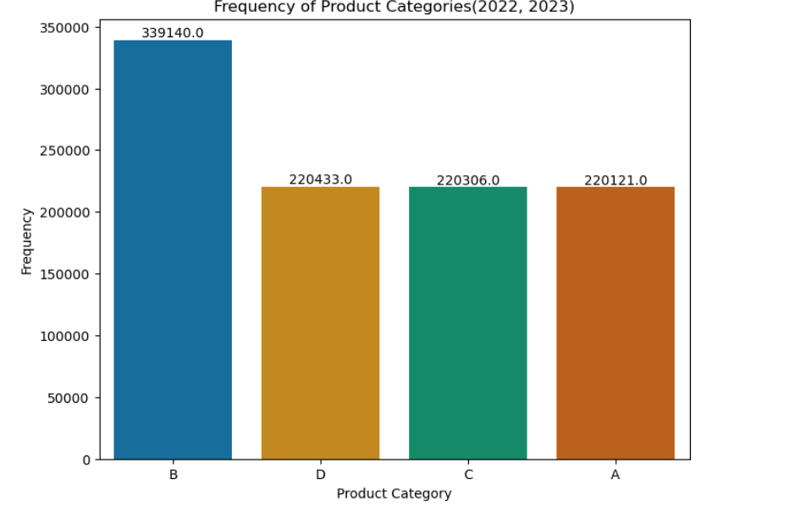
2. Product Categories Frequency
- The 'B' product category had the highest frequency, with approximately 110,000 more occurrences than the other categories ('A,' 'C,' and 'D'), which were relatively close in frequency.
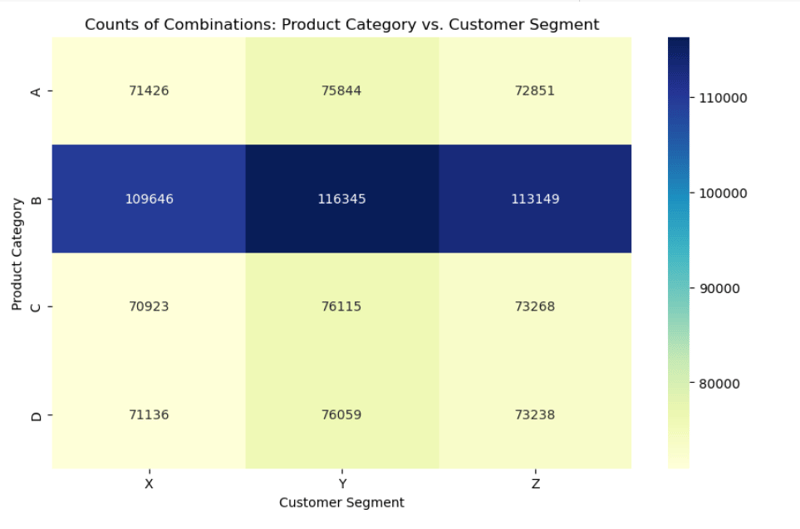
3. Product Category and Customer Segment Combination Frequency
- The combination of the 'Y' customer segment and 'B' product category was the most frequent.
4. Total Sales Amount for Each Product
- Product 78 recorded the highest total sales amount at 12,533,460, while product 21 had the lowest at 11,956,700. This indicates that total sales amounts are relatively close for different products.
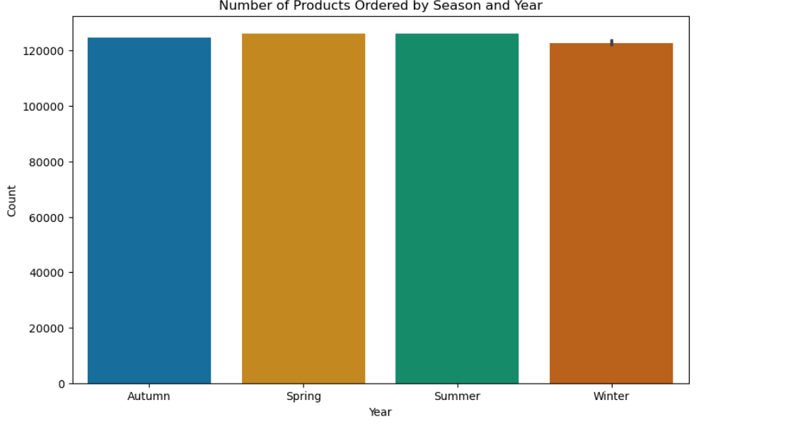
5. Number of Products Ordered by Season and Year (Bar Plot)
- Orders were notably lower in winter compared to other seasons. Additionally, the number of orders for each season in 2022 and 2023 was similar, except for winter, where 2023 saw fewer orders than 2022.
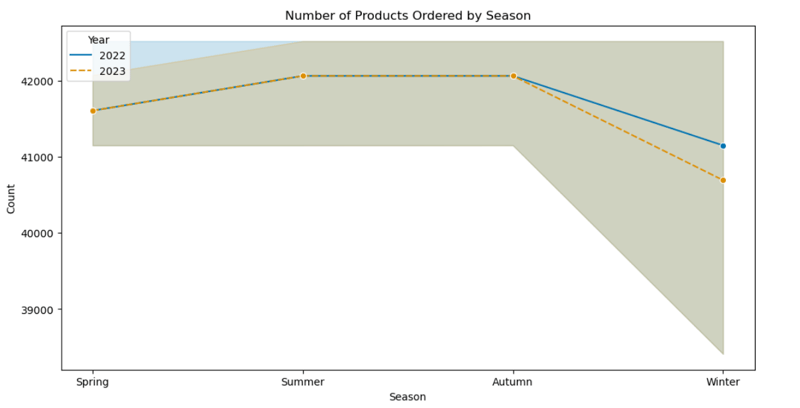
6. Number of Products Ordered by Season (Line Plot)
- A general decrease in product orders was observed during winter. The year 2023 showed a decline in orders compared to 2022, particularly in winter.
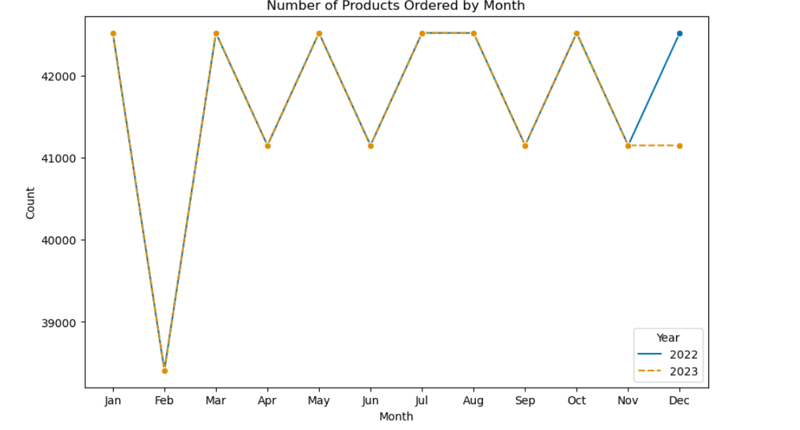
7. Number of Products Ordered by Month
- February recorded the lowest order rate. Orders were higher for odd months in the first half of the year and for even months in the second half, except for December 2023, which matched November 2023 in order volume.
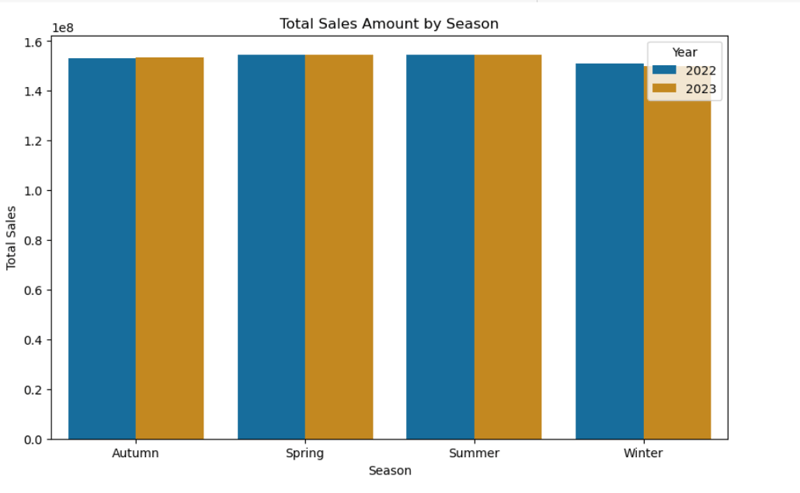
8. Total Sales Amount by Season
- Winter months in both 2022 and 2023 experienced lower total sales compared to other seasons. Additionally, total sales in winter 2023 were slightly lower than in winter 2022.
These exploratory analyses provide valuable insights into the dynamics of sales and customer behavior. By understanding these patterns, we can make informed decisions and develop strategies to optimize sales performance and drive revenue growth.
. Model Development and Evaluation
In this section, we detail the process of training and evaluating machine learning models to forecast total sales. The following steps outline our approach:
1. Data Preprocessing
We began by cleaning and preparing the dataset, handling missing values, and encoding categorical variables. This preparation was crucial for ensuring the dataset was suitable for modeling.
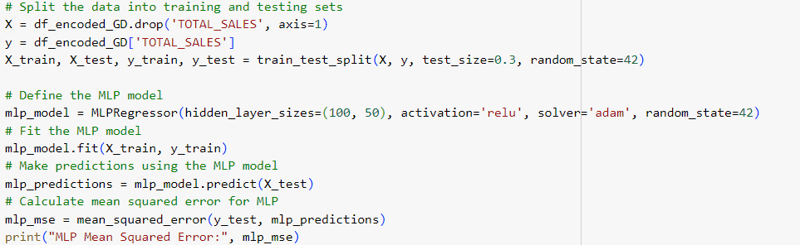
- Splitting the Data: We divided the preprocessed data into training and testing sets, allocating 70% for training and 30% for testing. This split helps us evaluate the model's performance on unseen data, ensuring a reliable assessment of its ability to generalize.
Although we initially aimed to use k-fold cross-validation for a more robust evaluation, memory limitations and the complexity of certain models like MLP, RBF, and XGBoost led us to use the train-test split method. Despite its simplicity, this method provides a viable alternative for assessing model performance.
2. Model Selection
We selected the following machine learning algorithms based on the complexity of the sales dataset and the nature of the problem:
MLP (Multi-Layer Perceptron): Suitable for capturing non-linear interactions and hidden patterns in the data, MLP can effectively handle the complexity of various customer segments, product categories, and seasonal patterns.
XGBoost: Known for its robustness against overfitting and ability to handle structured data, XGBoost helps identify feature importance and understand the factors affecting sales.
Random Forest: With its ensemble approach, Random Forest manages high-dimensional data well and reduces the risk of overfitting, offering stable predictions even with noisy data.
Gradient Boosting: By combining weak learners sequentially, Gradient Boosting captures complex feature relationships and improves model performance iteratively.
3. Training the Model
Each selected model was trained using the training dataset with the .fit() method.
4. Model Evaluation
We evaluated the trained models using several metrics:
Mean Squared Error (MSE): Measures the average of the squared differences between predicted and actual values. A lower MSE indicates better accuracy.
Mean Absolute Error (MAE): Calculates the average of the absolute differences between predicted and actual values, reflecting the average magnitude of errors. A lower MAE also indicates better performance.
R-squared Score: Represents the proportion of variance in the target variable (TOTAL_SALES) explained by the model. An R-squared score closer to 1 suggests a better fit.
Results Interpretation:
MLP (Multi-Layer Perceptron): Achieved very low MSE and MAE, with an R-squared score nearing 1, indicating excellent performance in predicting TOTAL_SALES.
XGBoost: Also performed well with relatively low MSE and MAE values and a high R-squared score, showing strong correlation between predicted and actual values.
Random Forest: Delivered the lowest MSE and MAE among all models and a high R-squared score, making it the most accurate for forecasting TOTAL_SALES.
Gradient Boosting: While it had higher MSE and MAE compared to other models, it still demonstrated a strong correlation between predictions and actual values with a high R-squared score.
In summary, the Random Forest model emerged as the best performer, with the lowest MSE and MAE and the highest R-squared score.
5. Hyperparameter Tuning
We performed hyperparameter tuning using techniques like grid search or random search to optimize the models' performance further.
6. Prediction
The trained models were used to make predictions on new data with the .predict() method.
7. Model Deployment
We deployed the best-performing model in a production environment to facilitate real-world use.
8. Model Monitoring and Maintenance
Continuous monitoring of the model’s performance is essential. We will update the model as needed to maintain accuracy over time.
9. Interpretation and Analysis
Finally, we analyzed the model’s results to gain actionable insights and make informed business decisions.
This comprehensive approach ensures that we develop robust, accurate models that can effectively forecast sales and support strategic decision-making.
. Business Insights
Our data analysis has uncovered several key insights that can drive sales growth and optimize business strategies:
1. Targeted Marketing
- The 'Y' customer segment demonstrated a higher purchase frequency compared to 'Z' and 'X.' To capitalize on this, we recommend implementing targeted marketing campaigns specifically designed for segment 'Y.' This approach can further engage this high-potential customer group and boost sales.
2. Product Promotion
- Product category 'B' showed the highest purchase frequency among all categories. Focusing promotional efforts on products within category 'B' can leverage its popularity and drive additional sales. Tailored marketing campaigns and special offers for this category can amplify its success.
3. Customer Rewards and Incentives
- Introducing a rewards program aimed at customer segments 'X' and 'Z' can encourage repeat purchases and build customer loyalty. Personalized discounts or incentives can motivate these segments to increase their purchase frequency and enhance overall sales.
4. Product Recommendations
- Utilizing data analytics to offer personalized product recommendations to customers in segment 'Y' and for products in category 'B' can significantly improve the shopping experience. Enhanced recommendations are likely to increase cross-selling opportunities and drive additional sales.
5. Improving Customer Experience
- Enhancing the overall customer experience—through exceptional customer support, intuitive interfaces, and seamless interactions—can positively influence all customer segments and product categories. A superior customer experience encourages conversions and fosters repeat business.
By leveraging these insights, we can tailor strategies to effectively target specific customer segments and product categories, optimizing sales performance and driving revenue growth. Continuous monitoring and adaptation based on ongoing data analysis will be crucial for maintaining success and achieving business objectives.
-
 您可以使用CSS在Chrome和Firefox中染色控制台输出吗?在javascript console 中显示颜色是可以使用chrome的控制台显示彩色文本,例如红色的redors,for for for for错误消息?回答是的,可以使用CSS将颜色添加到Chrome和Firefox中的控制台显示的消息(版本31或更高版本)中。要实现这一目标,请使用以下模...编程 发布于2025-06-13
 -
C++中如何将独占指针作为函数或构造函数参数传递?在构造函数和函数中将唯一的指数管理为参数 unique pointers( unique_ptr [2启示。通过值: base(std :: simelor_ptr n) :next(std :: move(n)){} 此方法将唯一指针的所有权转移到函数/对象。指针的内容被移至功能中,在操作...编程 发布于2025-06-13
-
如何从PHP中的数组中提取随机元素?从阵列中的随机选择,可以轻松从数组中获取随机项目。考虑以下数组:; 从此数组中检索一个随机项目,利用array_rand( array_rand()函数从数组返回一个随机键。通过将$项目数组索引使用此键,我们可以从数组中访问一个随机元素。这种方法为选择随机项目提供了一种直接且可靠的方法。编程 发布于2025-06-13
-
如何将多种用户类型(学生,老师和管理员)重定向到Firebase应用中的各自活动?Red: How to Redirect Multiple User Types to Respective ActivitiesUnderstanding the ProblemIn a Firebase-based voting app with three distinct user type...编程 发布于2025-06-13
-
Java中如何使用观察者模式实现自定义事件?在Java 中创建自定义事件的自定义事件在许多编程场景中都是无关紧要的,使组件能够基于特定的触发器相互通信。本文旨在解决以下内容:问题语句我们如何在Java中实现自定义事件以促进基于特定事件的对象之间的交互,定义了管理订阅者的类界面。以下代码片段演示了如何使用观察者模式创建自定义事件: args)...编程 发布于2025-06-13
-
如何使用Python有效地以相反顺序读取大型文件?在python 反向行读取器生成器 == ord('\ n'): 缓冲区=缓冲区[:-1] 剩余_size- = buf_size lines = buffer.split('\ n'....编程 发布于2025-06-13
-
PHP未来:适应与创新PHP的未来将通过适应新技术趋势和引入创新特性来实现:1)适应云计算、容器化和微服务架构,支持Docker和Kubernetes;2)引入JIT编译器和枚举类型,提升性能和数据处理效率;3)持续优化性能和推广最佳实践。 引言在编程世界中,PHP一直是网页开发的中流砥柱。作为一个从1994年就开始发展...编程 发布于2025-06-13
-
-
在C#中如何高效重复字符串字符用于缩进?在基于项目的深度下固定字符串时,重复一个字符串以进行凹痕,很方便有效地有一种有效的方法来返回字符串重复指定的次数的字符串。使用指定的次数。 constructor 这将返回字符串“ -----”。 字符串凹痕= new String(' - ',depth); console.Wr...编程 发布于2025-06-13
-
-
如何在Java中正确显示“ DD/MM/YYYY HH:MM:SS.SS”格式的当前日期和时间?如何在“ dd/mm/yyyy hh:mm:mm:ss.ss”格式“ gormat 解决方案:的,请访问量很大,并应为procectiquiestate的,并在整个代码上正确格式不多: java.text.simpledateformat; 导入java.util.calendar; 导入java...编程 发布于2025-06-13
-
PHP SimpleXML解析带命名空间冒号的XML方法在php 很少,请使用该限制很大,很少有很高。例如:这种技术可确保可以通过遍历XML树和使用儿童()方法()方法的XML树和切换名称空间来访问名称空间内的元素。编程 发布于2025-06-13
-
如何在其容器中为DIV创建平滑的左右CSS动画?通用CSS动画,用于左右运动 ,我们将探索创建一个通用的CSS动画,以向左和右移动DIV,从而到达其容器的边缘。该动画可以应用于具有绝对定位的任何div,无论其未知长度如何。问题:使用左直接导致瞬时消失 更加流畅的解决方案:混合转换和左 [并实现平稳的,线性的运动,我们介绍了线性的转换。这...编程 发布于2025-06-13
-
如何高效地在一个事务中插入数据到多个MySQL表?mySQL插入到多个表中,该数据可能会产生意外的结果。虽然似乎有多个查询可以解决问题,但将从用户表的自动信息ID与配置文件表的手动用户ID相关联提出了挑战。使用Transactions和last_insert_id() 插入用户(用户名,密码)值('test','test...编程 发布于2025-06-13


学习中文
- 1 走路用中文怎么说?走路中文发音,走路中文学习
- 2 坐飞机用中文怎么说?坐飞机中文发音,坐飞机中文学习
- 3 坐火车用中文怎么说?坐火车中文发音,坐火车中文学习
- 4 坐车用中文怎么说?坐车中文发音,坐车中文学习
- 5 开车用中文怎么说?开车中文发音,开车中文学习
- 6 游泳用中文怎么说?游泳中文发音,游泳中文学习
- 7 骑自行车用中文怎么说?骑自行车中文发音,骑自行车中文学习
- 8 你好用中文怎么说?你好中文发音,你好中文学习
- 9 谢谢用中文怎么说?谢谢中文发音,谢谢中文学习
- 10 How to say goodbye in Chinese? 再见Chinese pronunciation, 再见Chinese learning